The idea
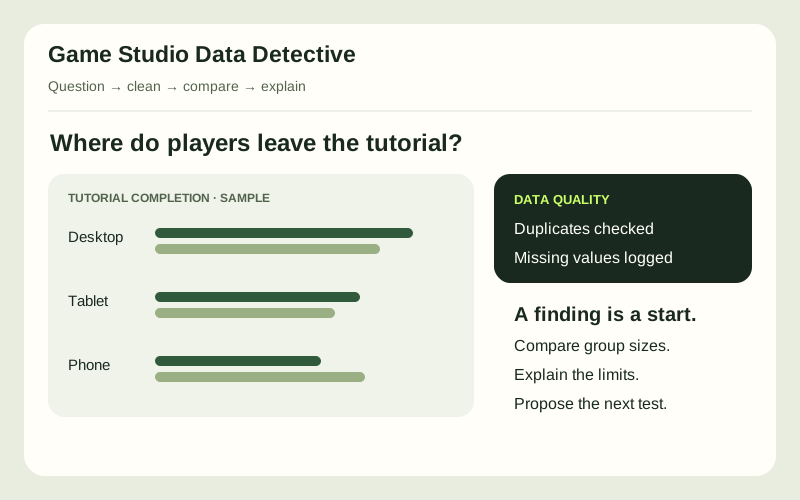
Help a fictional studio decide which onboarding problem to investigate first. Separate what the data supports from guesses about why players behave a certain way.
See this learning levelWhat you will build
- A reproducible cleaning pipeline for missing values, duplicate sessions and inconsistent labels.
- Comparisons by device and tutorial version, with clear denominators and sample sizes.
- A report linking each recommendation to a chart and a limitation of the data.
How it fits together
Use synthetic players, sessions and tutorial-event CSVs linked by anonymous IDs. Keep untouched input files, cleaned tables and derived metrics separate. Define session completion and repeat visits before calculating them.
Build milestones
Write the investigation brief
Choose a decision question, define three metrics and create a data dictionary for a synthetic dataset.
Audit and clean
Check IDs, dates, missing values and duplicates. Record each cleaning rule and how many rows it affects.
Compare fairly
Group by device and tutorial version. Check sample sizes, plot distributions and look for differences hidden by overall averages.
Make the case
Produce three annotated charts and one cautious recommendation, including alternative explanations and a proposed follow-up experiment.
How you will know it works
- Cleaned IDs and joins do not accidentally multiply sessions.
- Rates include their denominators; empty groups are not reported as zero performance.
- Re-running the analysis reproduces the figures, and recommendations avoid causal claims from observational data.
What you will finish with
A reproducible Python notebook, synthetic CSVs, a cleaning log and a concise studio decision report.
Take it further
Compare cohorts over time and explain how incomplete follow-up changes retention estimates.